# 18.10:性能统计
移动应用开发中会有性能统计相关的需求,比如想要统计应用的卡顿,内存使用以及 CPU 的占用等信息,统计这些信息可以方便的为后续优化做准备,本节笔者简单介绍一下如何在 OpenHarmony 上统计这些基础信息。
# 18.10.1:统计内存使用情况
ArkUI 开发框架在 @ohos.hidebug 模块中提供了获取应用内存使用情况的方法,包括应用进程的静态堆内存(native heap)信息、应用进程内存占用PSS(Proportional Set Size)信息等;可以完成虚拟机内存切片导出,虚拟机 CPU Profiling 采集等操作。简单样例如下所示:
引入 hidebug 模块
import hidebug from '@ohos.hidebug';1使用 hidebug 方法
private statisticMemoryInfo() {
  // native heap内存的已分配内存大小
  let nativeHeapSize = hidebug.getNativeHeapSize();

  // native heap内存的空闲内存大小
  let nativeHeapFreeSize = hidebug.getNativeHeapFreeSize();

  // 获取应用进程PSS内存大小
  let pss = hidebug.getPss();

  // 获取进程的共享脏内存大小。
  let sharedDirty = hidebug.getSharedDirty();

  // 获取进程的私有脏内存大小。
  let privateDirty = hidebug.getPrivateDirty();

  // 利用@ohos.app.ability.appManager模块的方法
  appManager.getAppMemorySize().then((size) => {
    console.log("memory size: " + size)
  }).catch((error) => {
    console.log("getAppMemorySize() error: " + JSON.stringify(error))
  })
}
1
2
3
4
5
6
7
8
9
10
11
12
13
14
15
16
17
18
19
20
21
22
23📢:getPrivateDirty() 方法在 API 9 才开始提供,另外在
@ohos.app.ability.appManager模块中也提供了获取进程内存的方法 getAppMemorySize()。
# 18.10.2:统计CPU占用情况
ArkUI 开发框架在 @ohos.hidebug 模块中提供了获取应用 CPU 占用情况的方法,简单样例如下所示:
引入 hidebug 模块
import hidebug from '@ohos.hidebug';1使用 hidebug 方法
private statisticCpuInfo() {
  // 获取进程的cpu占用率。
  let cpuUsage = hidebug.getCpuUsage();
}
1
2
3
4📢:getCpuUsage() 方法在 API 9 才开始提供。
# 18.10.3:统计帧率卡顿情况
帧率(Frame rate)是以帧称为单位的位图图像连续出现在显示器上的频率(速率)。统计帧率通常是在单位时间内统计屏幕的刷新率,刷新率越高就表示画面越流畅,目前对于帧率的统计,笔者还没有查到相关文档,等后续再补齐吧……
# 18.10.4:统计电池电量信息
ArkUI 开发框架在 @ohos.batteryInfo 模块中提供了获取设备电池信息的方法,简单样例如下所示:
引入batteryInfo
import batteryInfo from '@ohos.batteryInfo';1使用batteryInfo
private statisticBatteryInfo() {
  // 获取当前设备剩余电池电量百分比。
  var batteryPercent = batteryInfo.batterySOC;
  // 获取当前设备电池的充电状态。
  var batteryChargeState = batteryInfo.chargingStatus;
  // 获取当前设备电池的健康状态。
  var healthStatus = batteryInfo.healthStatus;
  // 获取当前设备电池的温度,单位0.1摄氏度。
  var batteryTemperature = batteryInfo.batteryTemperature;
}
1
2
3
4
5
6
7
8
9
10
# 18.10.5:完整样例
import hidebug from '@ohos.hidebug';
import appManager from '@ohos.app.ability.appManager';
import batteryInfo from '@ohos.batteryInfo';

@Entry @Component struct ArkUIClubProfileTest {

  @State memoryStr: string = "";
  @State cpuStr: string = "";
  @State frameStr: string = "";

  build() {
    Column({space: 10}) {

      Button("获取内存占用情况")
        .onClick(() => {
          this.statisticMemoryInfo()
        })

      Button("获取CPU使用情况")
        .onClick(() => {
          this.statisticCpuInfo()
        })

      Button("获取电池电量情况")
        .onClick(() => {
          this.statisticBatteryInfo()
        })

      Button("查看帧率卡顿情况")
        .onClick(() => {
          this.statisticFrameInfo()
        })

      Text(this.memoryStr)
        .fontSize(18)

      Text(this.cpuStr)
        .fontSize(18)

      Text(this.frameStr)
        .fontSize(18)
    }
    .width('100%')
    .height("100%")
    .padding(10)
    .backgroundColor("#aabbcc")
  }

  /**
   * 统计内存信息
   */
  private statisticMemoryInfo() {
    // native heap内存的已分配内存大小。
    let nativeHeapSize = hidebug.getNativeHeapSize();
    // native heap内存的空闲内存大小
    let nativeHeapFreeSize = hidebug.getNativeHeapFreeSize();
    // 获取应用进程PSS内存大小。
    let pss = hidebug.getPss();
    // 获取进程的共享脏内存大小。
    let sharedDirty = hidebug.getSharedDirty();
    // 获取进程的私有脏内存大小。
    let privateDirty = hidebug.getPrivateDirty();

    // 利用@ohos.app.ability.appManager模块的方法
    appManager.getAppMemorySize().then((size) => {
      console.log("memory size: " + size)
    }).catch((error) => {
      console.log("getAppMemorySize() error: " + JSON.stringify(error))
    })
  }

  /**
   * 统计 CPU 信息
   */
  private statisticCpuInfo() {
    // 获取进程的cpu占用率。
    let cpuUsage = hidebug.getCpuUsage();
  }

  /**
   * 统计电池信息
   */
  private statisticBatteryInfo() {
    // 获取当前设备剩余电池电量百分比。
    var batteryPercent = batteryInfo.batterySOC;
    // 获取当前设备电池的充电状态。
    var batteryChargeState = batteryInfo.chargingStatus;
    // 获取当前设备电池的健康状态。
    var healthStatus = batteryInfo.healthStatus;
    // 获取当前设备电池的温度,单位0.1摄氏度。
    var batteryTemperature = batteryInfo.batteryTemperature;
  }

  /**
   * 统计帧率信息
   */
  private statisticFrameInfo() {
  }
}
2
3
4
5
6
7
8
9
10
11
12
13
14
15
16
17
18
19
20
21
22
23
24
25
26
27
28
29
30
31
32
33
34
35
36
37
38
39
40
41
42
43
44
45
46
47
48
49
50
51
52
53
54
55
56
57
58
59
60
61
62
63
64
65
66
67
68
69
70
71
72
73
74
75
76
77
78
79
80
81
82
83
84
85
86
87
88
89
90
91
92
93
94
95
96
97
98
99
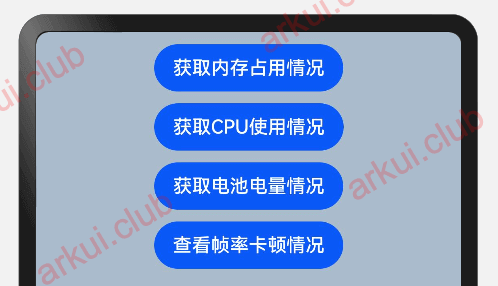
样例运行结果如下图所示:
# 18.10.6:小结
本节主要利用 ArkUI 开发框架在 @ohos.hidebug 模块中提供的 API 实现了内存和 CPU 的信息统计,对于帧率的统计,笔者目前还没有找到相关的 API,等后续笔者查到文档后再做补充。最后也非常欢迎小伙伴能给本网站提供更多的开发样例。